
Releasing ioflame: an eBPF based I/O tracer and visualizer
We’re happy to release ioflame, an I/O tracing tool that we developed internally to debug high I/O latency and wait time. ioflame attaches to the Linux kernel block level with eBPF probes, tracing all I/O activity. The resulting output of the trace is a flamegraph organized by filesystem hierarchy, showing the exact amount of bytes read or written by directory.
Here’s an example output from the repository, showing reads of some files not cached in the page cache:

In this post, we’ll explain why we needed to build this tool for Epsio, and do a deep dive into the Linux filesystem and I/O stack to understand why that’s a non trivial problem.
Profiling is.. easy?
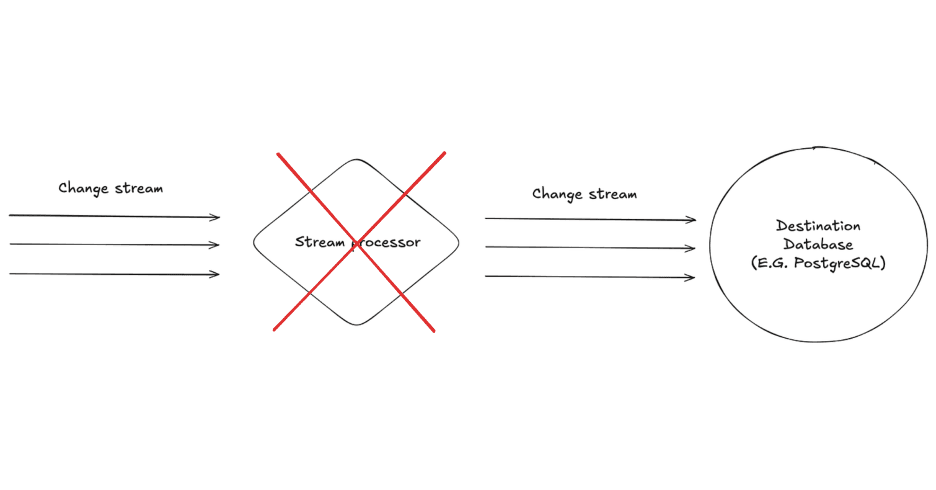
We’re building a Streaming SQL Engine, which is a SQL Engine that works on live changes to input data instead of having all the data up front in query time. Like any database, we care about performance. Thus we spend time profiling benchmark queries, trying to find our current bottlenecks. But what even is a bottleneck? What makes a database fast or slow?
There are 3 main resources that every software uses: CPU, Memory, and disk. In broad strokes, performance problems stem from inefficiently using one of these resources. Thus to improve performance, we need two things: A good understanding of how each of these resources work, and a good visibility on how we’re using them in practice. When we have an intuition on how something should optimally work, and knowledge on how far are we from that optimum in practice, we can start thinking on improvements we can make to our code. To look at a concrete case, let’s look at the CPU.
Understanding the CPU is understanding multicore parallelism, what are the standard algorithms for computing what we need to compute with a good time complexity, and a myriad of important low level details which are beyond the focus of this post.
From the visibility perspective, we have great tools to see what’s going on in real time. At a high level, we can get basic utilization percentages for each core. We can then dig deeper with flamegraphs from data recorded by a profiler, as well as per CPU performance counters, to get high resolution data on what our CPUs are doing.
For example, we can look at this zoomed in part of a flamegraph of one of our runs:

There’s some noise here, but we can see that we spend most of our time in this section on writing to RocksDB SSTs, with serialization and allocation also taking a big part of the runtime. This is very useful information! We can start asking questions like: Are we writing more data than we should? Can we avoid serialization? Can we reduce our allocations done in the hot path? etc. So when it comes to the CPU, we have good visibility that enables us to improve our performance.
A database has another crucial resource: Disk. We can understand it well, and know that i.e it is a block based device, that random writes on SSDs are not a great idea and so on. But what about visibility?
We can get a high level view and see that we’re blocked on I/O via CPU utilization data, and specifically wait%, which is the % of time in which the CPU sits idle and waits for I/O to complete. For example, consider the following graph:

In it we can see a ~60% wait. This means that most of the time, instead of doing something useful, the CPUs are waiting for I/O. We can also look at the disk queue, which is where requests are waiting to be sent to the drive, and see that it’s packed:

But knowing we wait on I/O is only half the way there. We want to see why we’re doing that much I/O. In the CPU case, a high utilization is a good global indicator, but the flamegraph helped us really understand what’s going on. How can we do that when profiling I/O?
That’s where things get complicated, and that’s the issue we set out to solve with ioflame.
I/O tracing: a surprisingly hard problem
Ideally, we’d like to a level of observability similar to what perf gives us on the CPU, but instead of hot functions we’d like to find hot directories or files. We want to know which files are read or written the most, how many bytes are read or written from each directory in total, etc. so we could discover hotspots. We first tried known tools, but all of them didn’t fit to our specific use case for one of these reasons:
Too high level:
iostatis incredibly helpful to get the high level picture, for example whether the problem is many reads or many writes. But what are we doing that’s causing the I/O? That’s hard to tell fromiostatalone. Other tools like biosnoop provided more information, like PID and latency, but no information about the file level.Can’t distinguish page cache operations from actual I/O: One can imagine using
stracewith some wrapper script to trace all thereadandwritesyscalls a program does. This would work in theory, but won’t tell us much about actual I/O done!That’s because we won’t know if a read was served from the Page cache or the disk, or which of the writes was flushed to the block device.
Since we’d naturally see high wait% when the page cache is close to full, the thrashing in this case would aggravate the problem: A small % ofreads can access files whose pages aren’t cached at read time, but cause the most I/O and thus the high wait%.
This will be hard to tell if we track both cached and uncached reads together.This behavior exists in eBPF based tools like filetop. Similar to
iostat,filetopand similar tools were great for an initial overview of where we might have problems, but wasn’t precise enough for our use case.Not tracking all types of I/O: File I/O is not necessarily the result of
read,writeorfsyncon a file descriptor. For example, we usemmapbuffers as a simple disk backed channel between operators, to avoid OOMs when large amounts of data are involved. While we’re sure we want to phase them out for this use case in the future, when we’re debugging high wait% currently we‘d like to know if mmap buffers are the cause.The problem is that mmap buffers are almost invisible to observability tools, most of which operate at the filesystem or syscall level. That’s because a read from mmaped memory is a simple pointer dereference. If the read page is not mapped, a page fault will occur, and the kernel page fault handler will issue a read from the filesystem to get the page from disk. All of this happens deep in the kernel, with no direct userspace action we can reasonably hook.
I should stress that we used some of these tools together to understand what’s going on in high wait% cases, and each tool worked great. But combining them didn’t work for us at scale. In complicated benchmark queries we can have tens of RocksDB directories, each with hundreds of SST files, as well as many mmap buffers. All of these being read, written and deleted at a rapid pace. For these cases the combination of tools and heuristics wasn’t enough.
We wanted a single tool that has low overhead, catches any type of I/O, attributes it to a path, and displays the result in an easy to understand visualization. In short, the experience we’ve gotten used to from CPU profilers.
We experimented with ad-hoc bpftrace scripts that used ext4 probes, but we wanted a proper tool that worked on any filesystem and environment. So we wrote ioflame.
But how does it work? Where do we want to put a probe, and what data should we record in it?
To answer that we’ll need to understand the Linux I/O stack a bit better, which we’ll do by tracing the path a read takes from userspace to the block layer. We won’t cover the write path, but the concepts are similar.
Life of a read
Let’s say that userspace issues a read syscall from some file. The read goes then through several layers in the Linux kernel, until it reaches the device driver, descending in the abstraction level from files to disk blocks. The layers are the syscall, VFS, page cache, filesystem code and finally the block layer.
Here’s a diagram of the path through the different layers, with the relevant kernel functions in each layer. We’ll explain each layer in detail next:

The diagram was created by printing the kernel stack at submit_bio with bpftrace, at the read time.
Before we get into each layer, let’s understand what we need of our hook.
We need it to be at a layer low enough so that it captures all I/O and doesn’t run on page cache hits, but we also need it to record high level information about which file was accessed. We’d also like it to be as generic as possible, not relying on specific filesystems or disk types.
Given these requirements, let’s look at the different layers and see what they give us. Note that the same layer can be called in different levels of the stack. For instance ext4 is called both directly by the generic VFS logic, and then in the case of a cache miss by the page cache. So the different layers are:
Syscall: The first path running the kernel as a result of our
read.
This isn’t a good place to hook: there are many different syscalls that eventually result in disk I/O, and at this stage we won’t know if the read is from cached data or not.VFS: The next layer is VFS. This layer sits between the syscall layer and the actual filesystem code. It provides a common abstraction that all filesystems use, so that the syscall layer doesn’t need to know the filesystem specifics. It also provides common helpers that all filesystems can use. For example,
generic_file_read_iterabove connecting between the filesystem and the page cache logic.While this layer is an awesome abstraction in general, for our purposes it’s a bit too high in the call stack. In
vfs_reador in the VFS helpers we still don’t know whether the pages are read from the page cache or not.ext4: The filesystem specific logic. This could be a great place to hook, for instance hooking
ext4_readaheadright which is called right before issuing the block layer request sounds exactly like what we need. That’s because at this point in time we know that we had a cache miss, since the page cache code called the read logic.One problem with hooking this layer is that we would need to have a per filesystem hook. Since we want to be as generic as possible, that’s a no go for us. Ideally, we’d like different filesystems to work out of the box with our hook, without adapting per filesystem.
Another problem is the fact that not all filesystem calls correspond to actual I/O. One example is truncated files, or the more general concept of “holes” in files. These are parts of the file that are marked by the filesystem to be filled with zeros. There aren’t actual zero bytes stored on the block device itself though, since a metadata marker indicating a hole is enough. Thus a read of such a hole, even though it does go through the filesystem logic, won’t actually trigger any I/O (except for metadata, which is tiny and is probably cached anyway).
So the filesystem specific code isn’t ideal for a hook. What else do we got?
Page cache: Part of the complex memory management subsystem. Called by VFS helpers to try and get the read page from the page cache. In case of a miss, it initiates a read from the filesystem. This layer is close to ideal, and a
read_pageshook was used in our initial implementation.
The only real problem with it is the hole problem mentioned above. At this point, we only know that a page isn’t resident in the cache and needs to be read from disk. But what if this page is part of a file that was justtruncated? We’ll mark the read as actual I/O done, when it isn’t.This isn’t that big of a deal, and this approach would work, but this is an issue we would encounter in our usage of mmap buffers, for example. We decided to dig deeper and try to find a hook which doesn’t have this problem. This brings us to the..
Block layer: The last level before actual device drivers, sending requests from the filesystem to read individual blocks. This sounds like the perfect place to hook. We can put a probe on
submit_bio, which by definition sends I/O requests to the block device, so we know we are actually reading from disk. There is one problem though: since we are in a very low level in the stack, it’s hard to relate I/O to actual files it’s done on, which was our point all along!In upper layers of the stack, for instance in the page cache miss code, we have the
filestruct easily available to us. By design, these layers work on files, not blocks, so it’s not surprising that it’s easy to relate a page miss to a file. In the block layer however, all types of I/O are mixed — general filesystem metadata blocks, journal records, and actual data blocks which we care about. So it makes sense that a relation to a file, if there is one, would be harder to obtain.
Luckily, extracting file information in the block layer is hard but not impossible, as we’ll see later. But first, what data should we even use to relate the operation to a file? Is there any file information this close to the device driver?
Associating bio requests with files
In Linux, each file is associated with a unique inode. The file inode contains the metadata about the file, like its size and permissions. But most importantly it allows us to uniquely identify a file as a tuple of 3 fields of the inode: The inode number i_ino, the block device in which the inode resides s_dev, and the inode generation i_generation.
This means that if we can a reference to an inode struct in submit_bio somehow, we’d be almost done! We’ll only need to extract the amount of bytes read or written and whether it’s a read or a write. So what’s the signature of submit_bio?
void submit_bio(struct bio *bio)
Hmm, not very telling. Looking at struct bio members, unsurprisingly there is no inode field we could read, which makes sense due to the block layer level of abstraction as we discussed above. There was also no file struct member or anything like that allows us to get the inode..
But then we remembered something. After all, we’re reading from a file into a page. Thus there must be some page struct somewhere in the bio that maybe could have the backing inode. And indeed, we found this in the kernel code:
/*
 * main unit of I/O for the block layer and lower layers (ie drivers and
 * stacking drivers)
 */
struct bio {
  ...
  struct bio_vec  *bi_io_vec; /* the actual vec list
};
...
/**
 * struct bio_vec - a contiguous range of physical memory addresses
 * @bv_page:   First page associated with the address range.
 * @bv_len:    Number of bytes in the address range.
 * @bv_offset: Start of the address range relative to the start of @bv_page.
 * ...
 */
struct bio_vec {
 struct page *bv_page;
 unsigned int bv_len;
 unsigned int bv_offset;
};
So we can easily find the page accessed in the bio, great! Getting from the page to the inode is easy: page has a member of type struct address_space *, which has a pointer to the inode.
Tracking Direct I/O is a bit more complex to track as the read page is a userspace buffer page and not a file backed page, but we resolved that by hooking another bio submission function which has the file inode in Direct I/O.
To distinguish file backed I/O requests from general metadata I/O that we don’t want to track, we can use the same logic the kernel uses to detect if a page is anonymous, i.e not backed by a file: if the lower bit of the address_space isn’t set, we know that the page is backed a file and we can proceed.
Finally, we write the read or written bytes to an eBPF percpu map, keyed by the inode. After reading a 1GB file, the map would look like this:

This is great, but something is missing. What we eventually want is paths, not inode numbers. How can we get that?
To userspace and beyond
An inode struct is a unique handle to a file with metadata and not much more. It doesn’t have the file path, since paths are at a higher level of abstraction. Many paths even point to the same inode via hardlinks. Thus finding the path from the inode just doesn’t make sense. This means we’ll need to hook some location right after opening a file with a path, which will have both the inode and path, then store it in a mapping like so:

In general, resolving the path of a file in eBPF isn’t trivial due to the eBPF verifier (resolving a path is a loop which can’t be proven to terminate), so we opted for the simpler solution of resolving it in userspace with procfs: In kernel space, we’ll hook a file open function, which will give us both the inode opened, the PID who opened it and the fd it got. Then in userspace we’ll read the path from /proc/<pid>/fd.
We decided to hook fd_install, which gets called whenever a new fd is opened by any process. Here we have all we need: a struct file containing the inode, with the pid and fd also available. We send this to userspace via an eBPF ringbuffer, which then resolves the path as described above, and stores it in the mapping.
In userspace we link the information from both maps, use inferno to produce a flamegraph per directory, and we’re done!
Wrapping up
The initial version of ioflame is on Github. With this basic architecture in place, we can imagine other cool features we’d like to add:
Tracking over time, allowing comparing I/O patterns over time with something like a differential flamegraph
Adding a richer UI to enable better filtering
Adding probes to track page cache inserts and evicts, to produce a visualization of page cache residency over time
But all of that is in the future. For now we finally have the I/O visualizer we needed.
btw, did we mention we’re building a cool Streaming SQL Engine?